Pages

Monday 22 May 2017

All in the family

WALT:Create graphs to communicate ideas
Activity One
1.The line graph, because it's not suitable of finding the statement of data.
2.The pie graph, because it shows less information.
3.It is true because all three graphs shows that the number 2 is the highest.
4.The best graphs to answer is Lani’s because the graph is easy to answer.
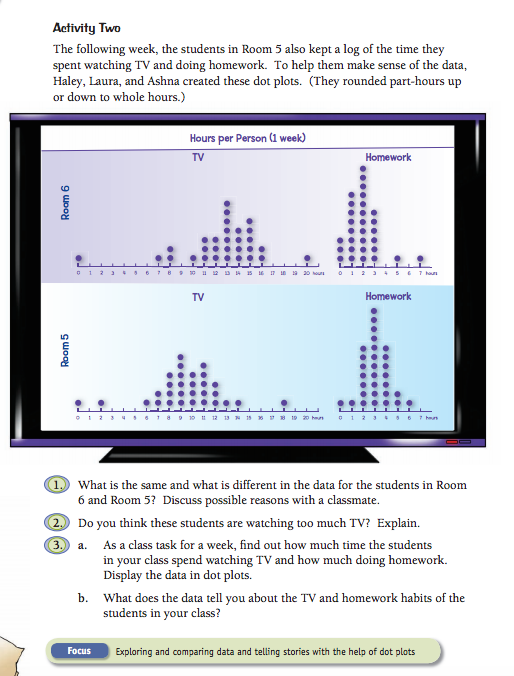


 Activity Two
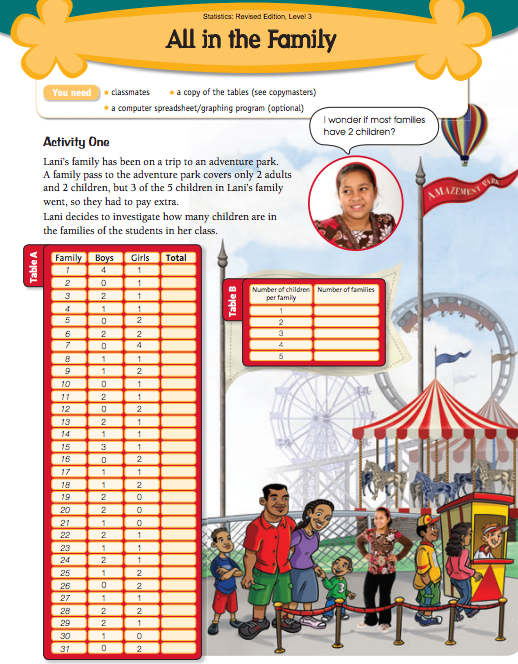
1. In Lani’s family she only has 2 sister (Plus me) and 3 brothers.
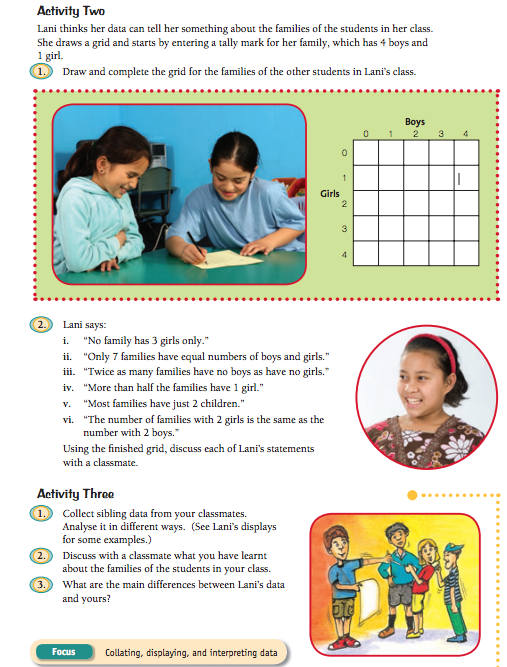
2. Lani says their is no families that only has three girls in the family.


Friday 12 May 2017

The Vege car

WALT: Summarising - I can locate and summarise ideas e.g. skim and scan, identify key words, topic sentences, key questions, or by using sub headings" 


This task was to summarise ideas using skim and scan. This book was about a man named James Nui who invented a vege car. So what that means is that James nui uses vegetable oil as fuel.


Wednesday 10 May 2017

Too much telly

WALT:Interpret a range of different graphs  

Answer below:

1: They spent more watching TV then doing their homework

2: It’s different because the times changes every week/day

3: Yes because they spent more time watching TV and least time amount doing their homework


Answer questions below:

1:   Same: they both spend more time watching tv
    Different:Room 5 spend more time doing their homework that room 6

2: Yes because, Did you know that if you watch the TV too much it could disturb you brain and it could also interfere or damage your eyesight.

3: They spend more time doing other things or watching tv than Home Work, What I think we need to do is to at least spend 10 - 20 minutes answering 5 - 10 questions.


Friday 5 May 2017

The Cipher Wheel

WALT:I capture the essence of the ideas in text and re-state or paraphrase in my own words

This task was all about learning and knowing what a cipher wheel was and how it's used. We also learn't different words and the meaning's like decipher, and paraphrase. 

Thursday 4 May 2017

Maths - Choice Squares

WALT: Interpret a range of different graphs

WORK 1

Why do you think Mr Winiata drew the question?
Answer: Because some students may have more that one favourite fruit

2. Which three graph/chart are shown?
Answer: Pie chart, Bar Graph, Pictograph

3. Which graph do you think most clearly shows in Room 8’s favourite fruit? (Explain why)
Answer: Bar graph, I choose this graph because it shows how much fruit there are and also what type of fruit it is.


This week we have been learning all about graphs and how we solve out problems using the graphs. This is all what we think the best graph is.